Capturing Warehouse
Inventory Visibility
Supply Chain | Internal Tech Product

Redesigning Warehouse Management System
How did the redesign and streamlining of warehouse processes result in a 40% reduction in operational costs and a 30% increase in warehouse accuracy?
Role
Focus Groups, Competitor Analysis, Visual Design, User Flows, Prototyping, Usability Testing, Cross Functional Team Collaboration
Timeline
3 Months, 2023
Project Type
UX Research, Internal Product, Web & Mobile App Design, Business Technology
Tools
Figma, Notion, Whimsical
Company
Bazaar Technologies
What was the Problem?
Bazaar Technologies, dedicated to modernizing the traditional retail landscape in Pakistan, operated more than 70 warehouses nationwide to serve retail shops of all sizes through the Bazaar customer app. However, as a thriving startup, challenges emerged with the adoption of a conventional warehousing management setup.
Current warehouse management system suffered from inaccurate utilization calculations and inadequate item location tracking, leading to inefficient resource allocation, operational delays, and increased risks of inventory misplacement.

The Kickoff
Understanding the operations at the Warehouse called 'K2'
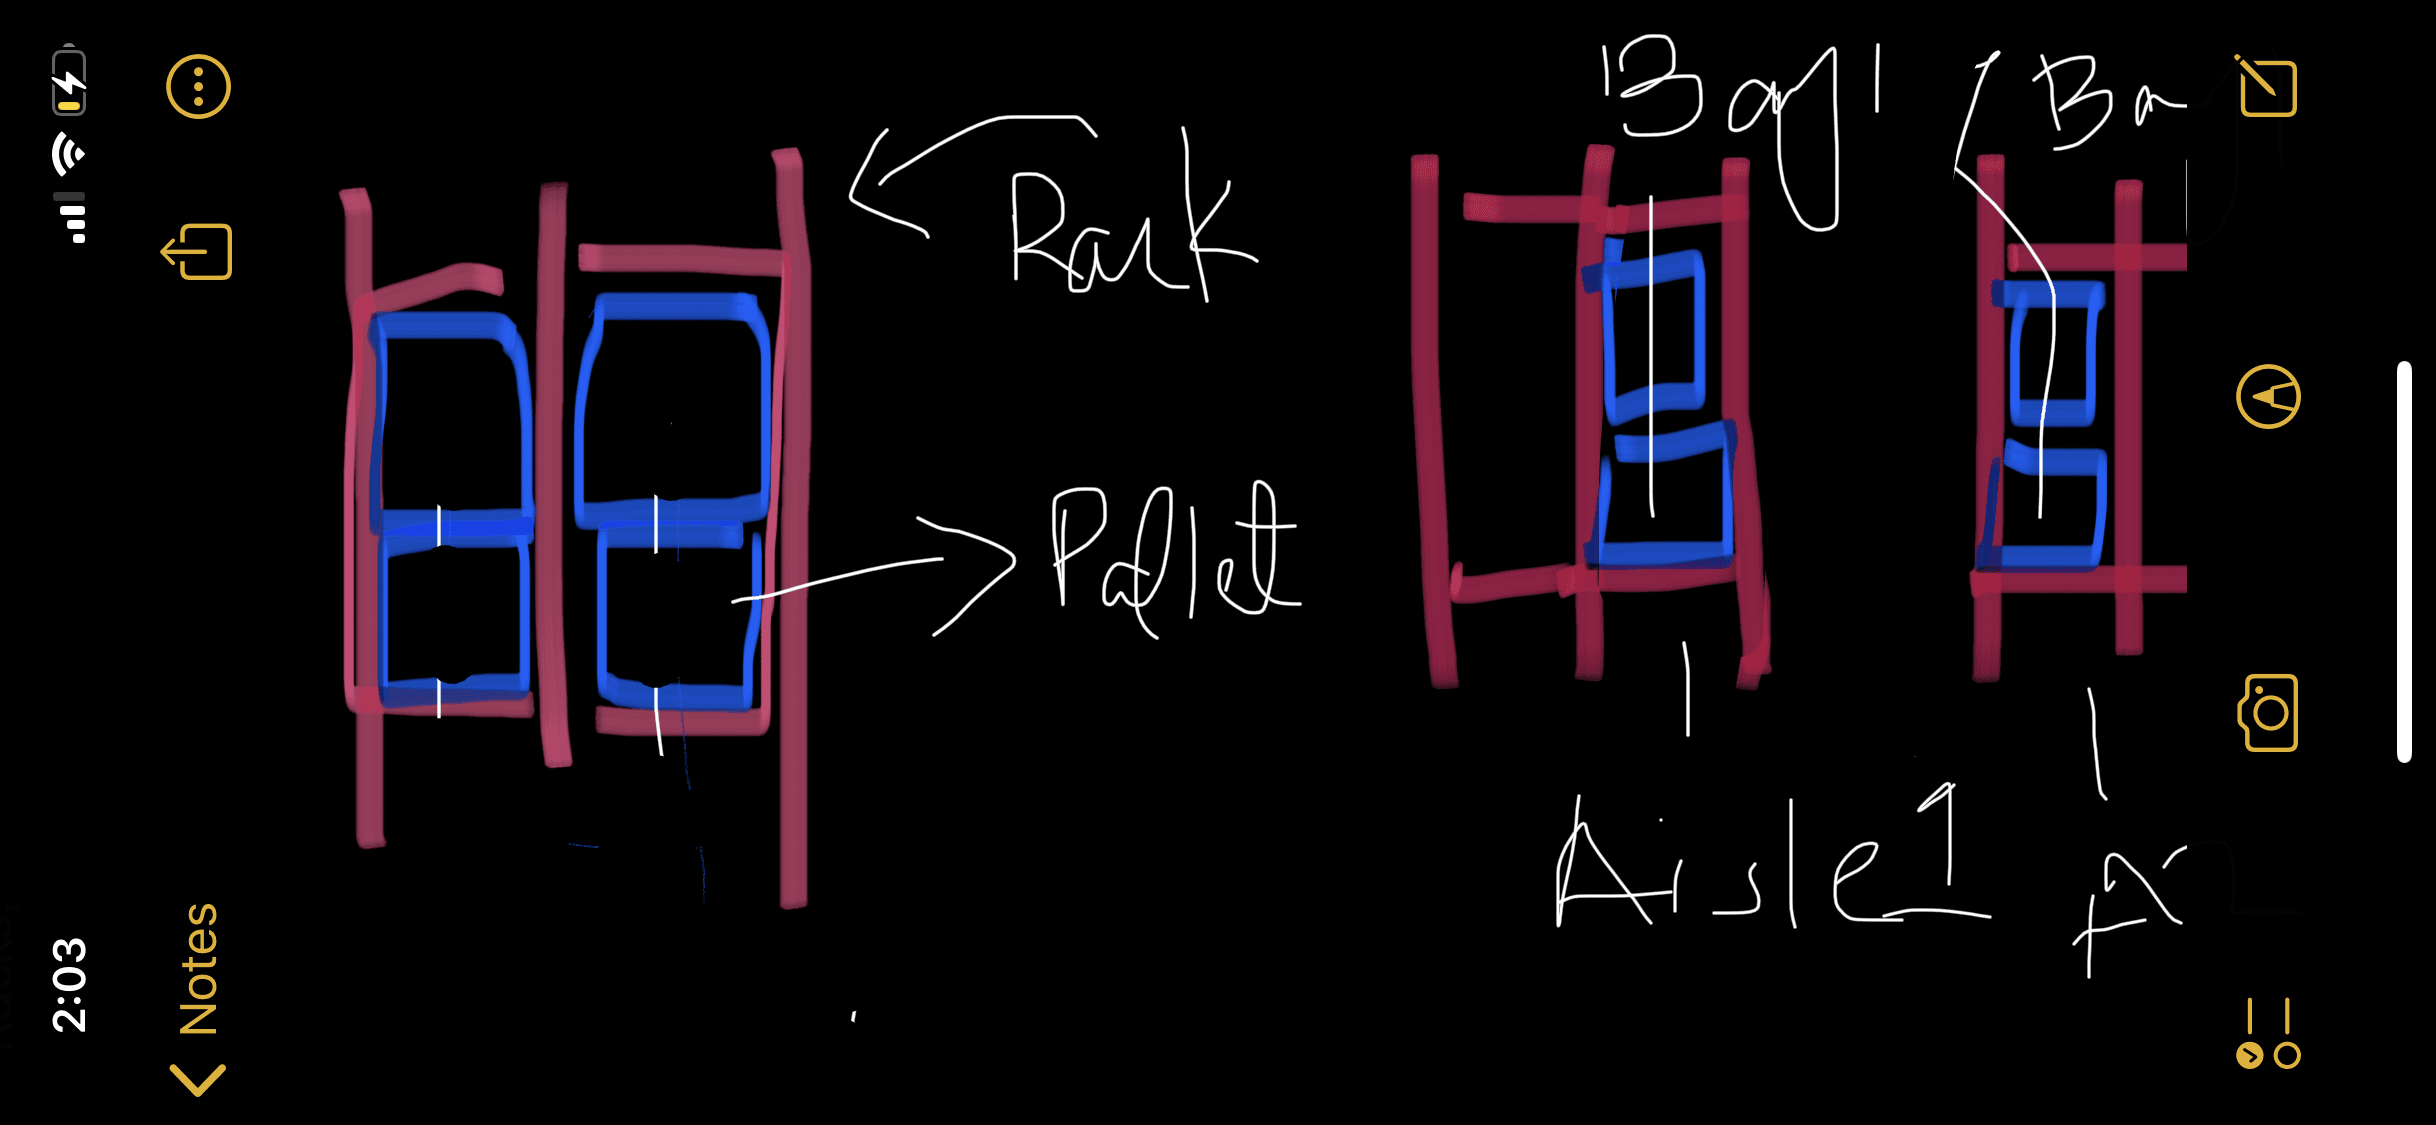
Sketching the Anatomy of Warehouse Logistics: Mapping Out Racks, Pallets,
Bays, and Aisles for understanding the logistics.

Inventory Control Tags for labelling 'Racks' in each aisle
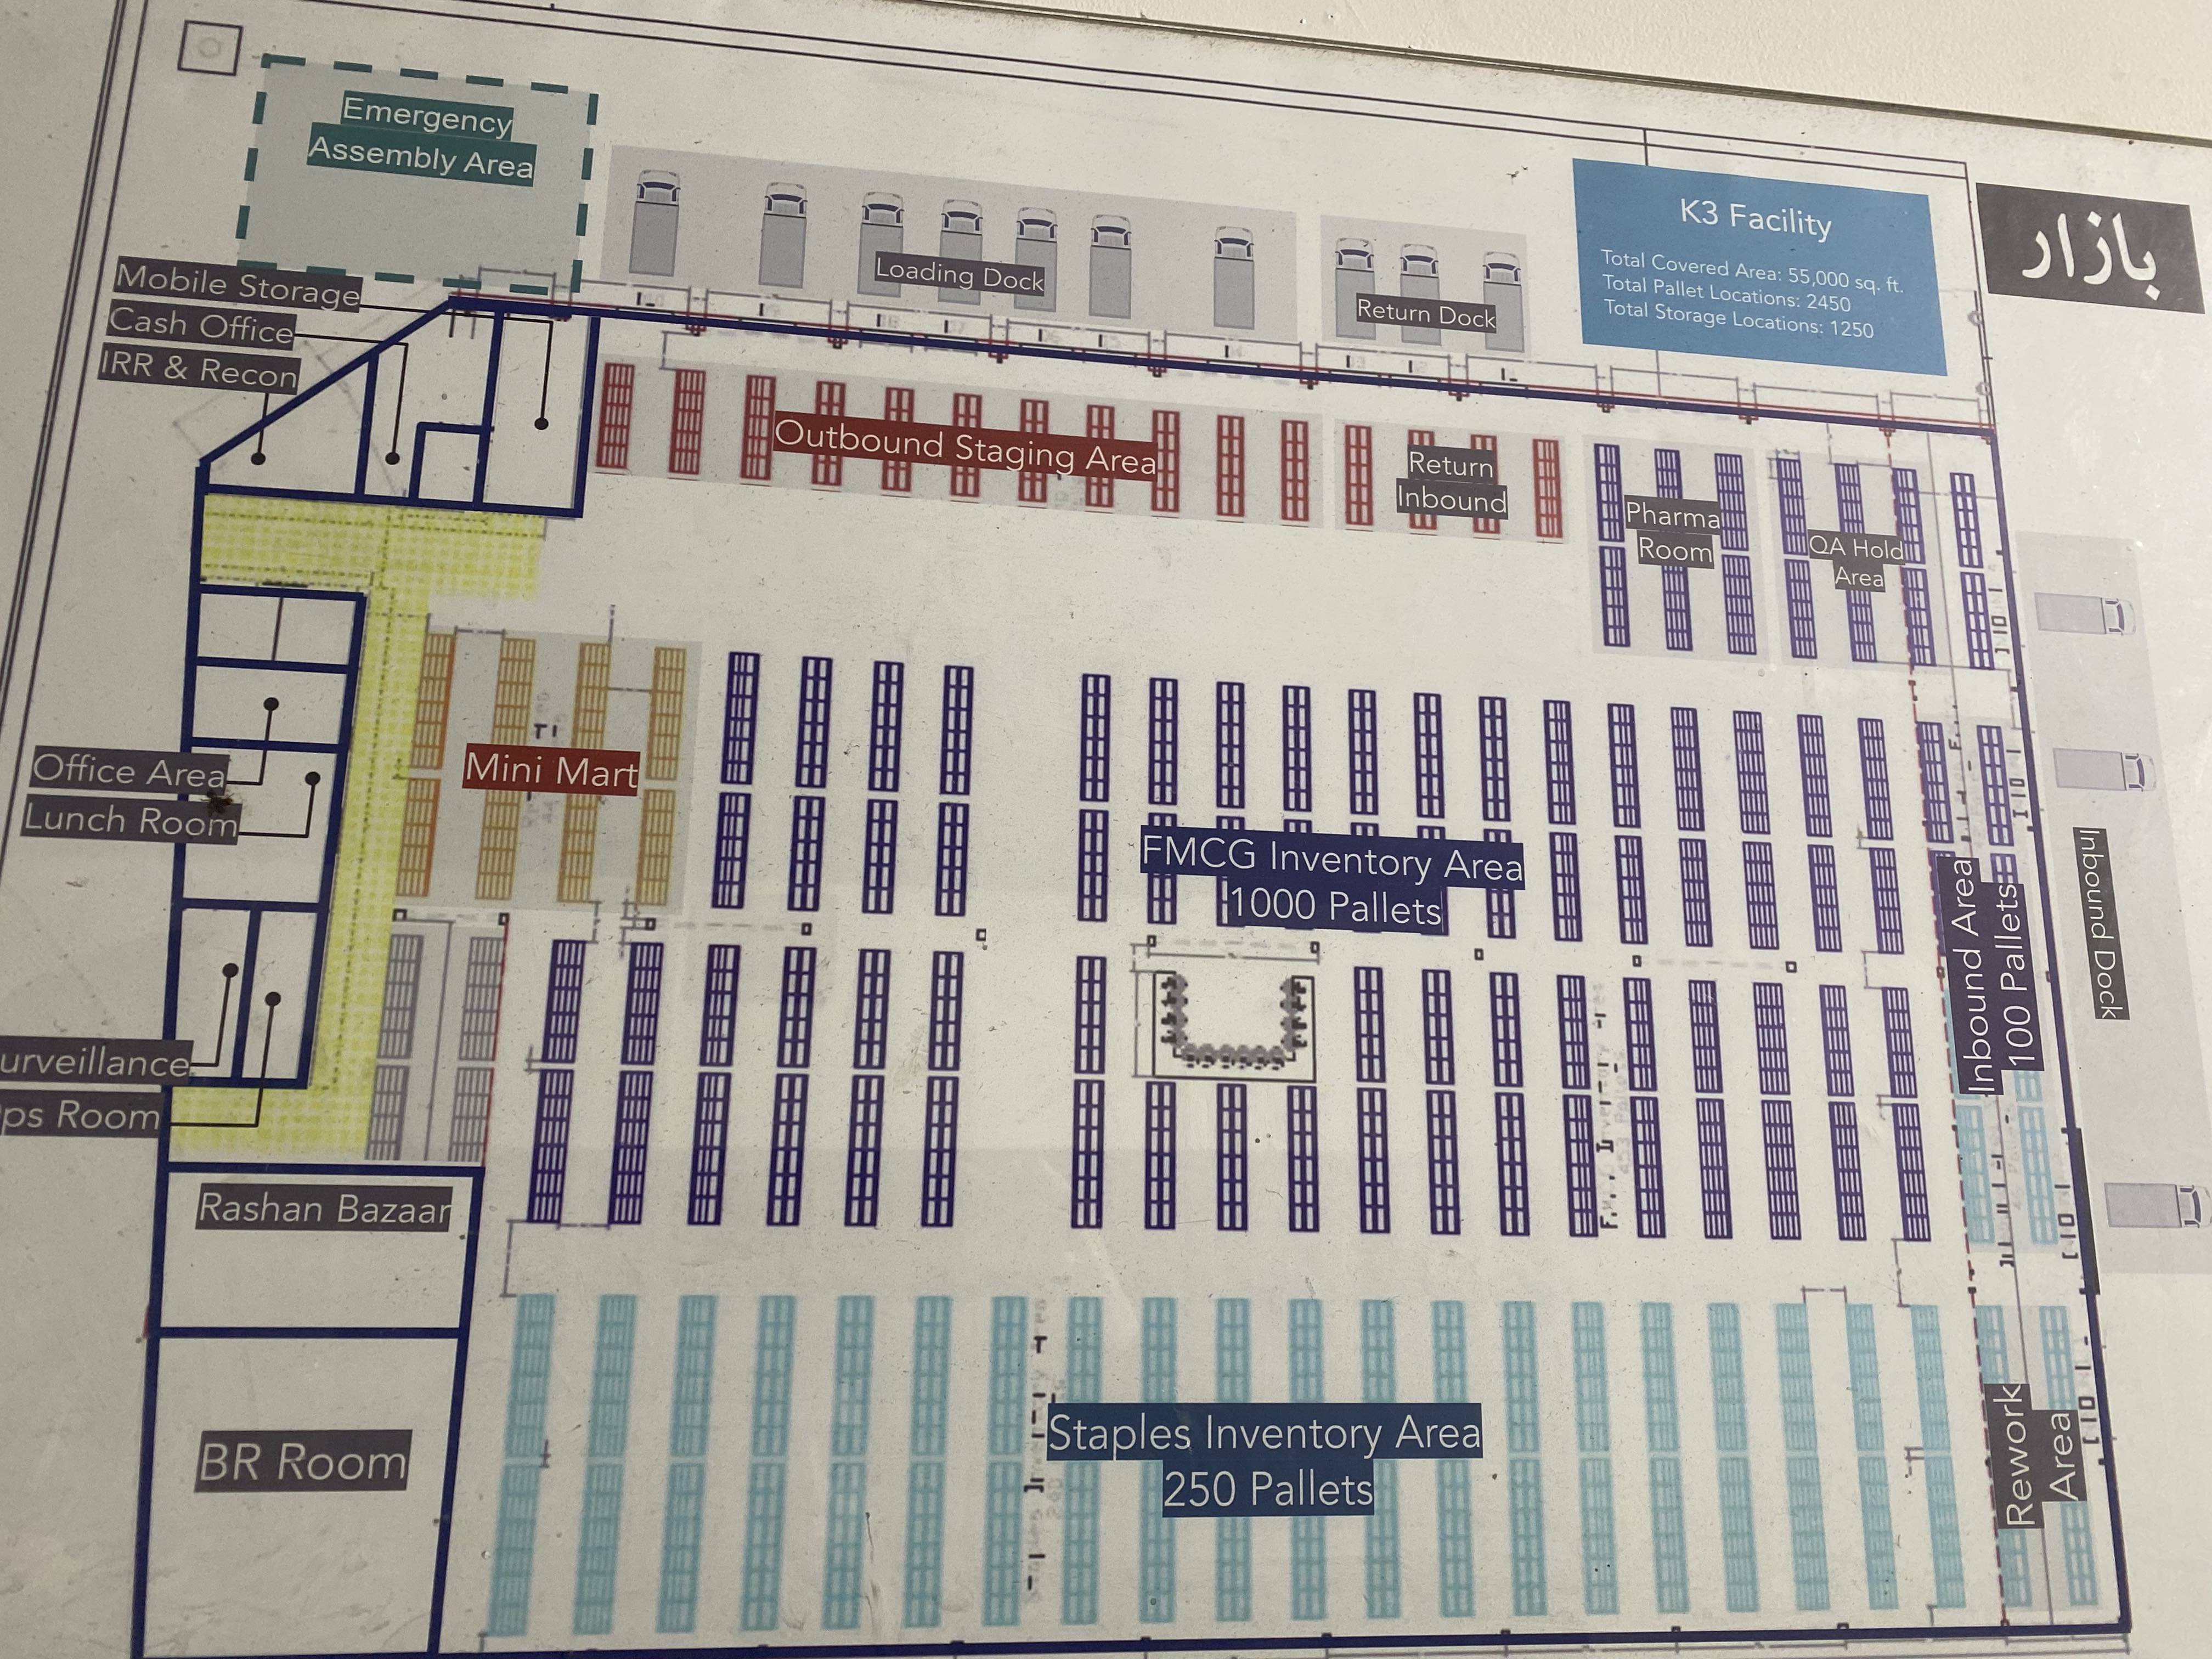
The current floor map which is being followed for
the K3 Warehouse.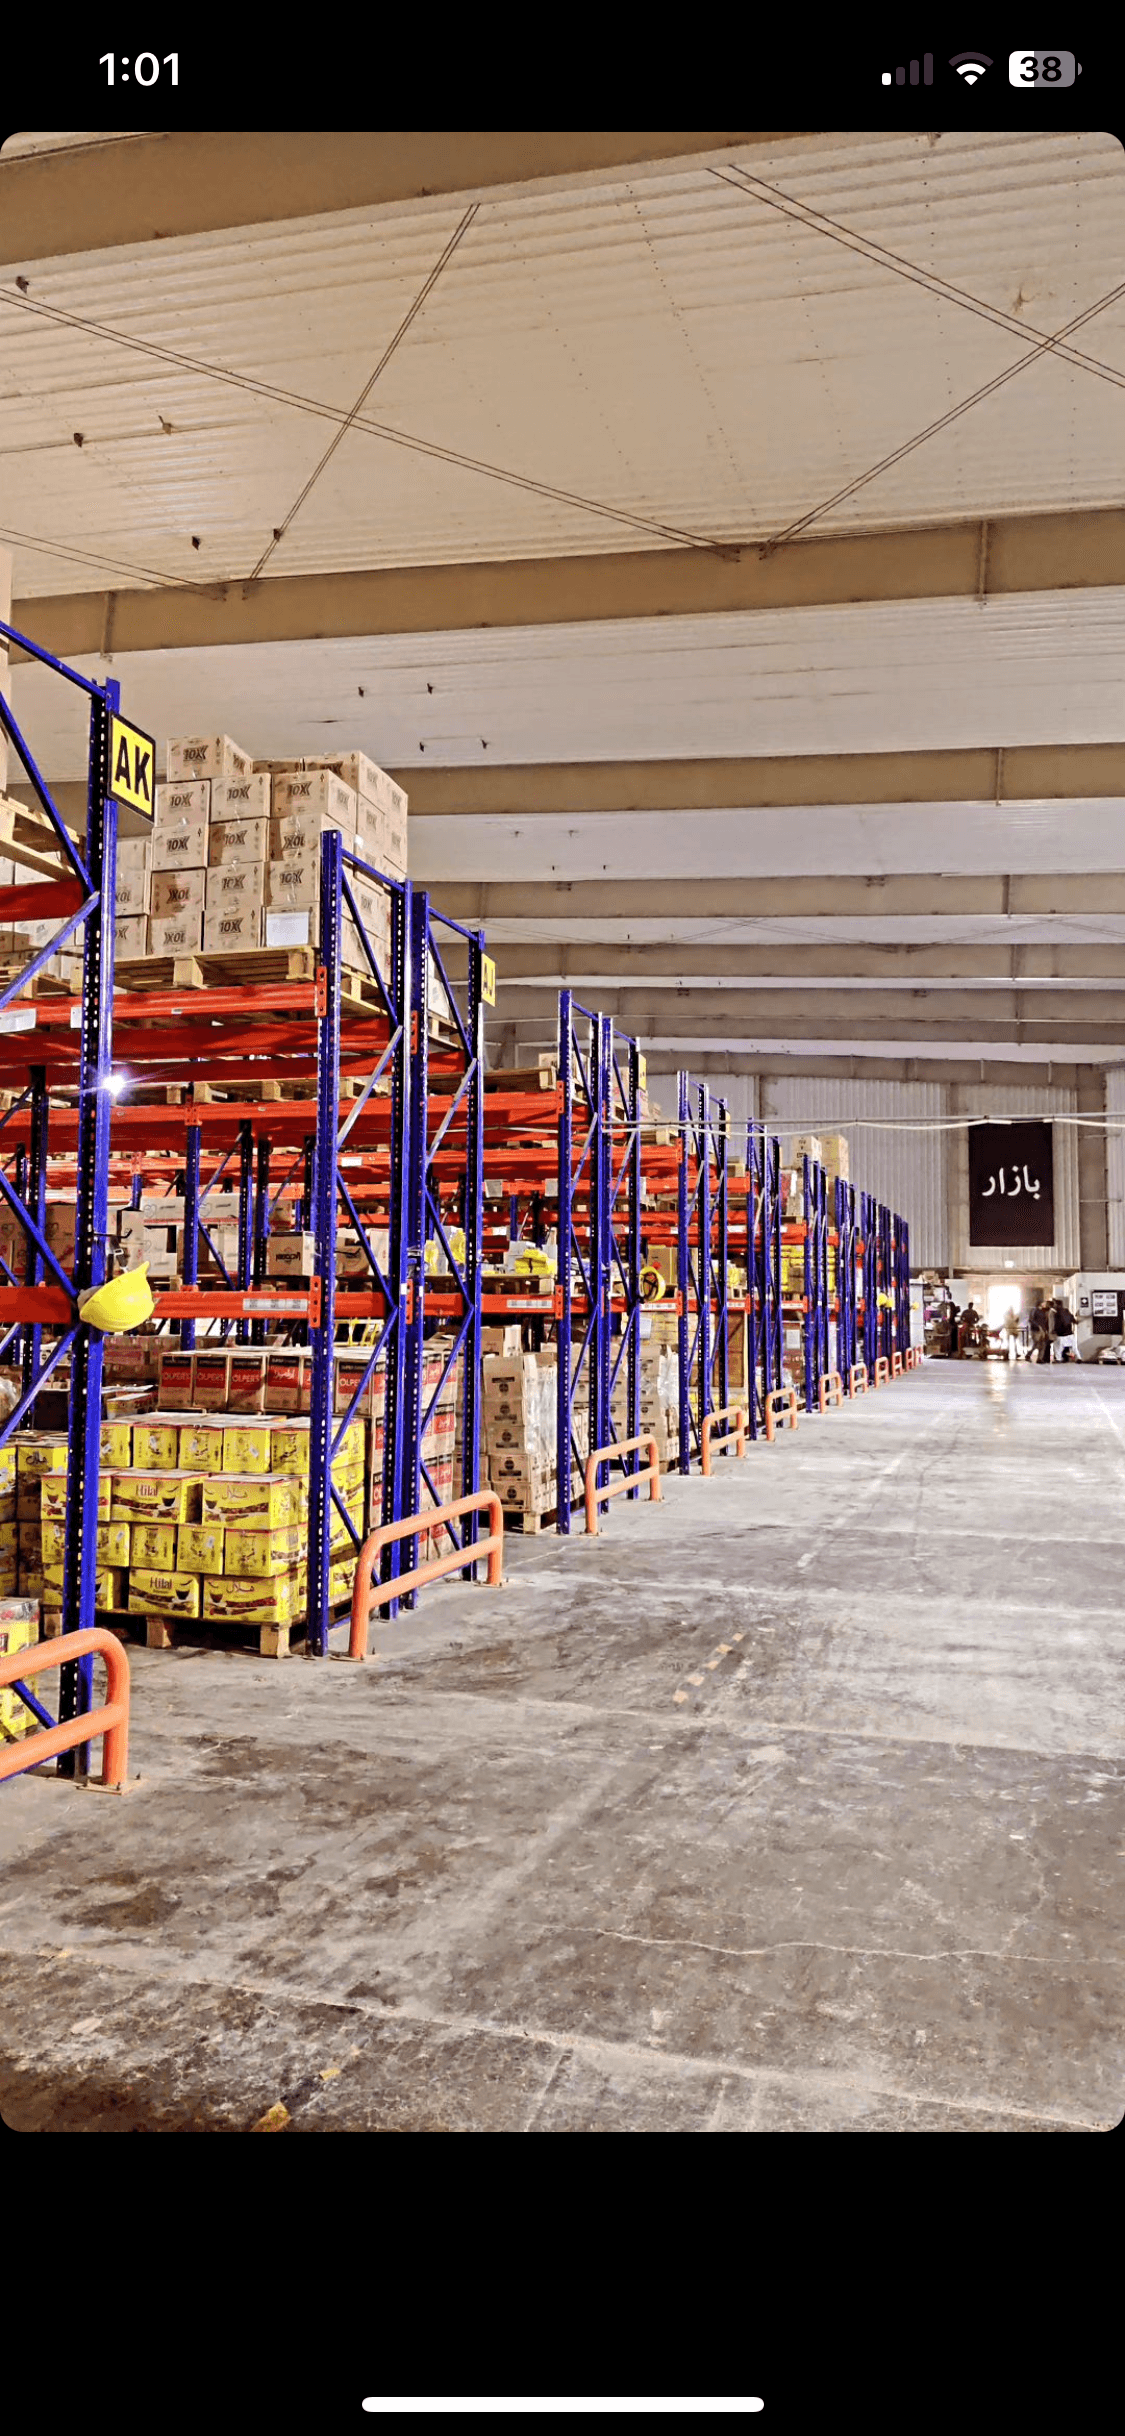
Conducted Focus group sessions with the warehouse stakeholders which
included Operational Team, Warehouse Managers, Supervisors, Stockers, and Order Selectors.

An allocated area purposed for assembling large orders and preserving
them until they're prepared to be released for distribution.
The primary challenge was to align insights from K2 operations and competitor analysis to improve the overall inventory management system. This included implementing enhanced visibility for product locations, accurate warehouse utilization calculation, improved tracking mechanisms, and a systematic approach to warehousing. The overarching goal was to understand the holistic impact of these changes on order processing and overall business operations.
Insights
From the Warehouse visits & Focused groups
⚠️
Currently, a notable delay exists between the physical movement of stock within the warehouse and its corresponding update in the Warehouse Management System (WMS). This lag results in a lack of real-time reflection of stock movements, impacting the immediate visibility of warehouse activities.
⚠️
Unable to calculate warehouse utilization from the system
⚠️
Unable to know what is placed where
⚠️
Unable to practice of chaotic warehousing systematically
Competitive Analysis
Since our earlier research findings from market visit and focused groups revealed visibility problems of warehouse activities on the Warehouse Management Portal, I decided to conduct a Competitive Analysis with the goal of understanding how other warehouse models are managing their real time reflection of stock movements on their portals. Also with the focus on the user-flow and Information Arrangement of these other warehouse
web-portals.


Agility:
Main Workflow -
WMS → Execution → Inventory → Balance
Inventory Balance → Location → Search
Searching Location level for inventory balance - can do item level as well
Daraz:
Main Workflow -
WMS → Inventory → List of SKUs
Search → Item → Location (always above the list)
Similar Key Findings for both:
→ Search is a key action for visibility
→ Filters for search and list are very helpful
→ Provided column search parameters for visibility
→ Use PDA (handheld computer device) to capture data on the floor
Approach
Project Breakdown
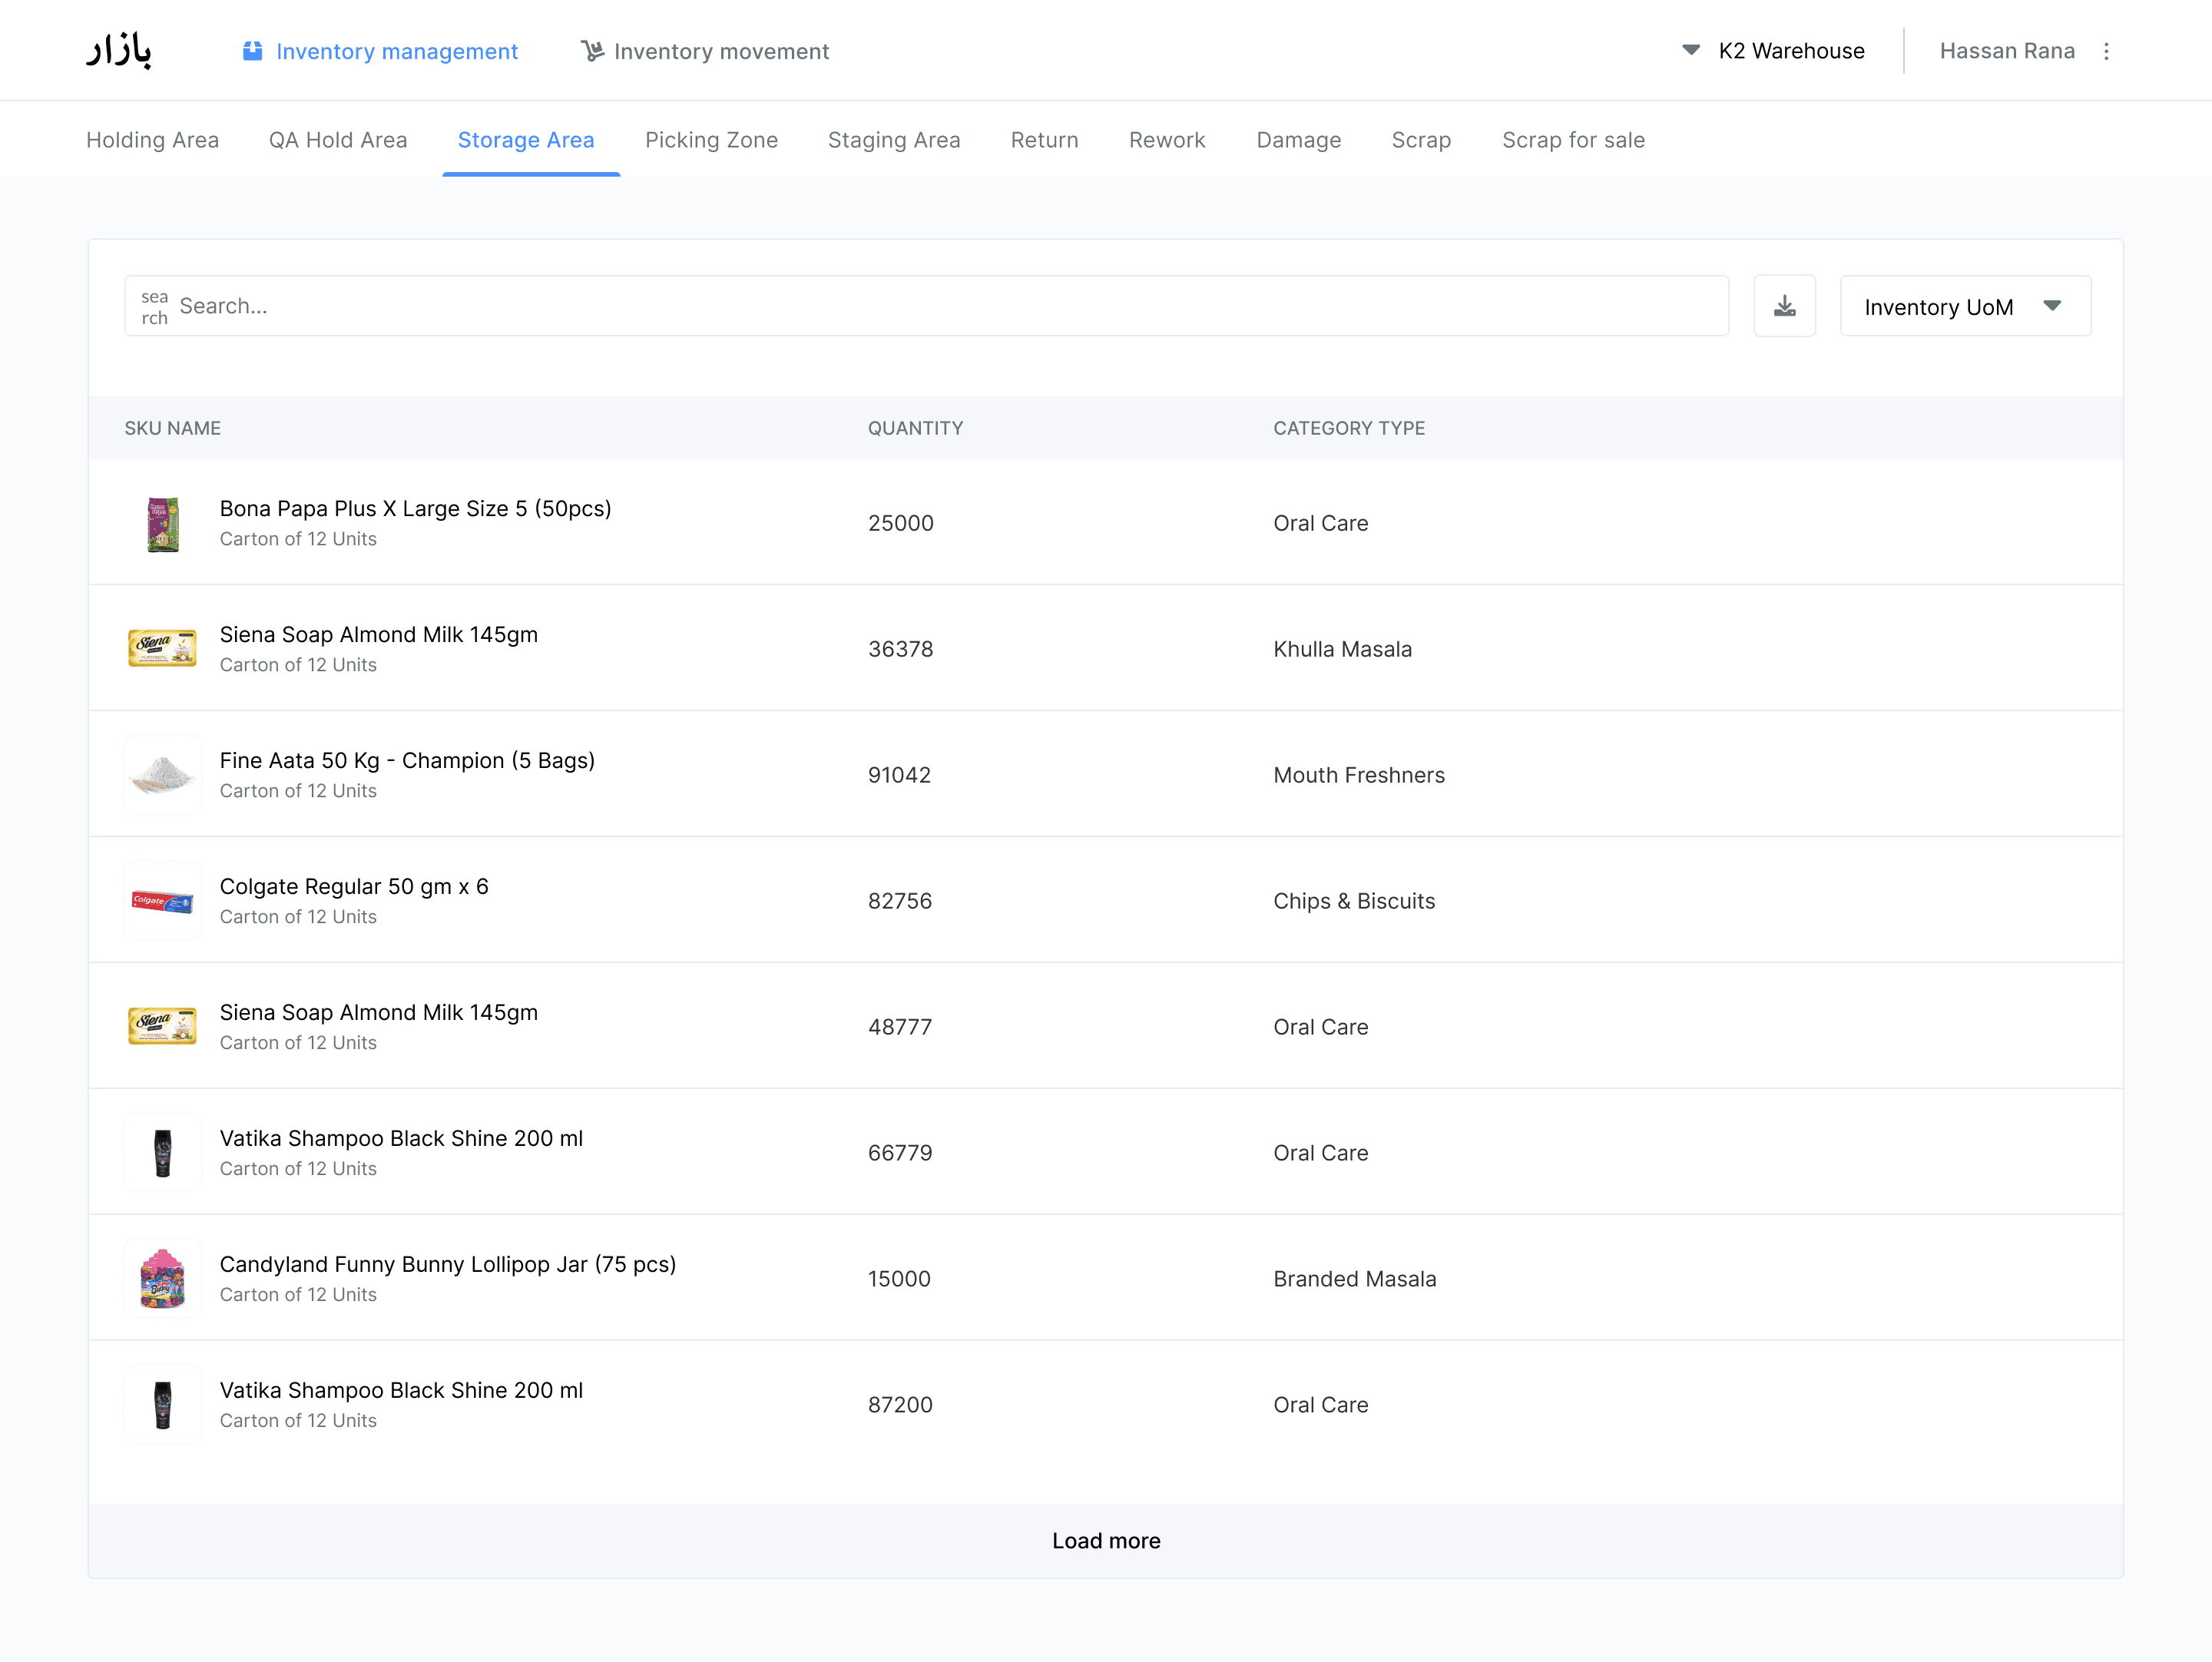
🔦
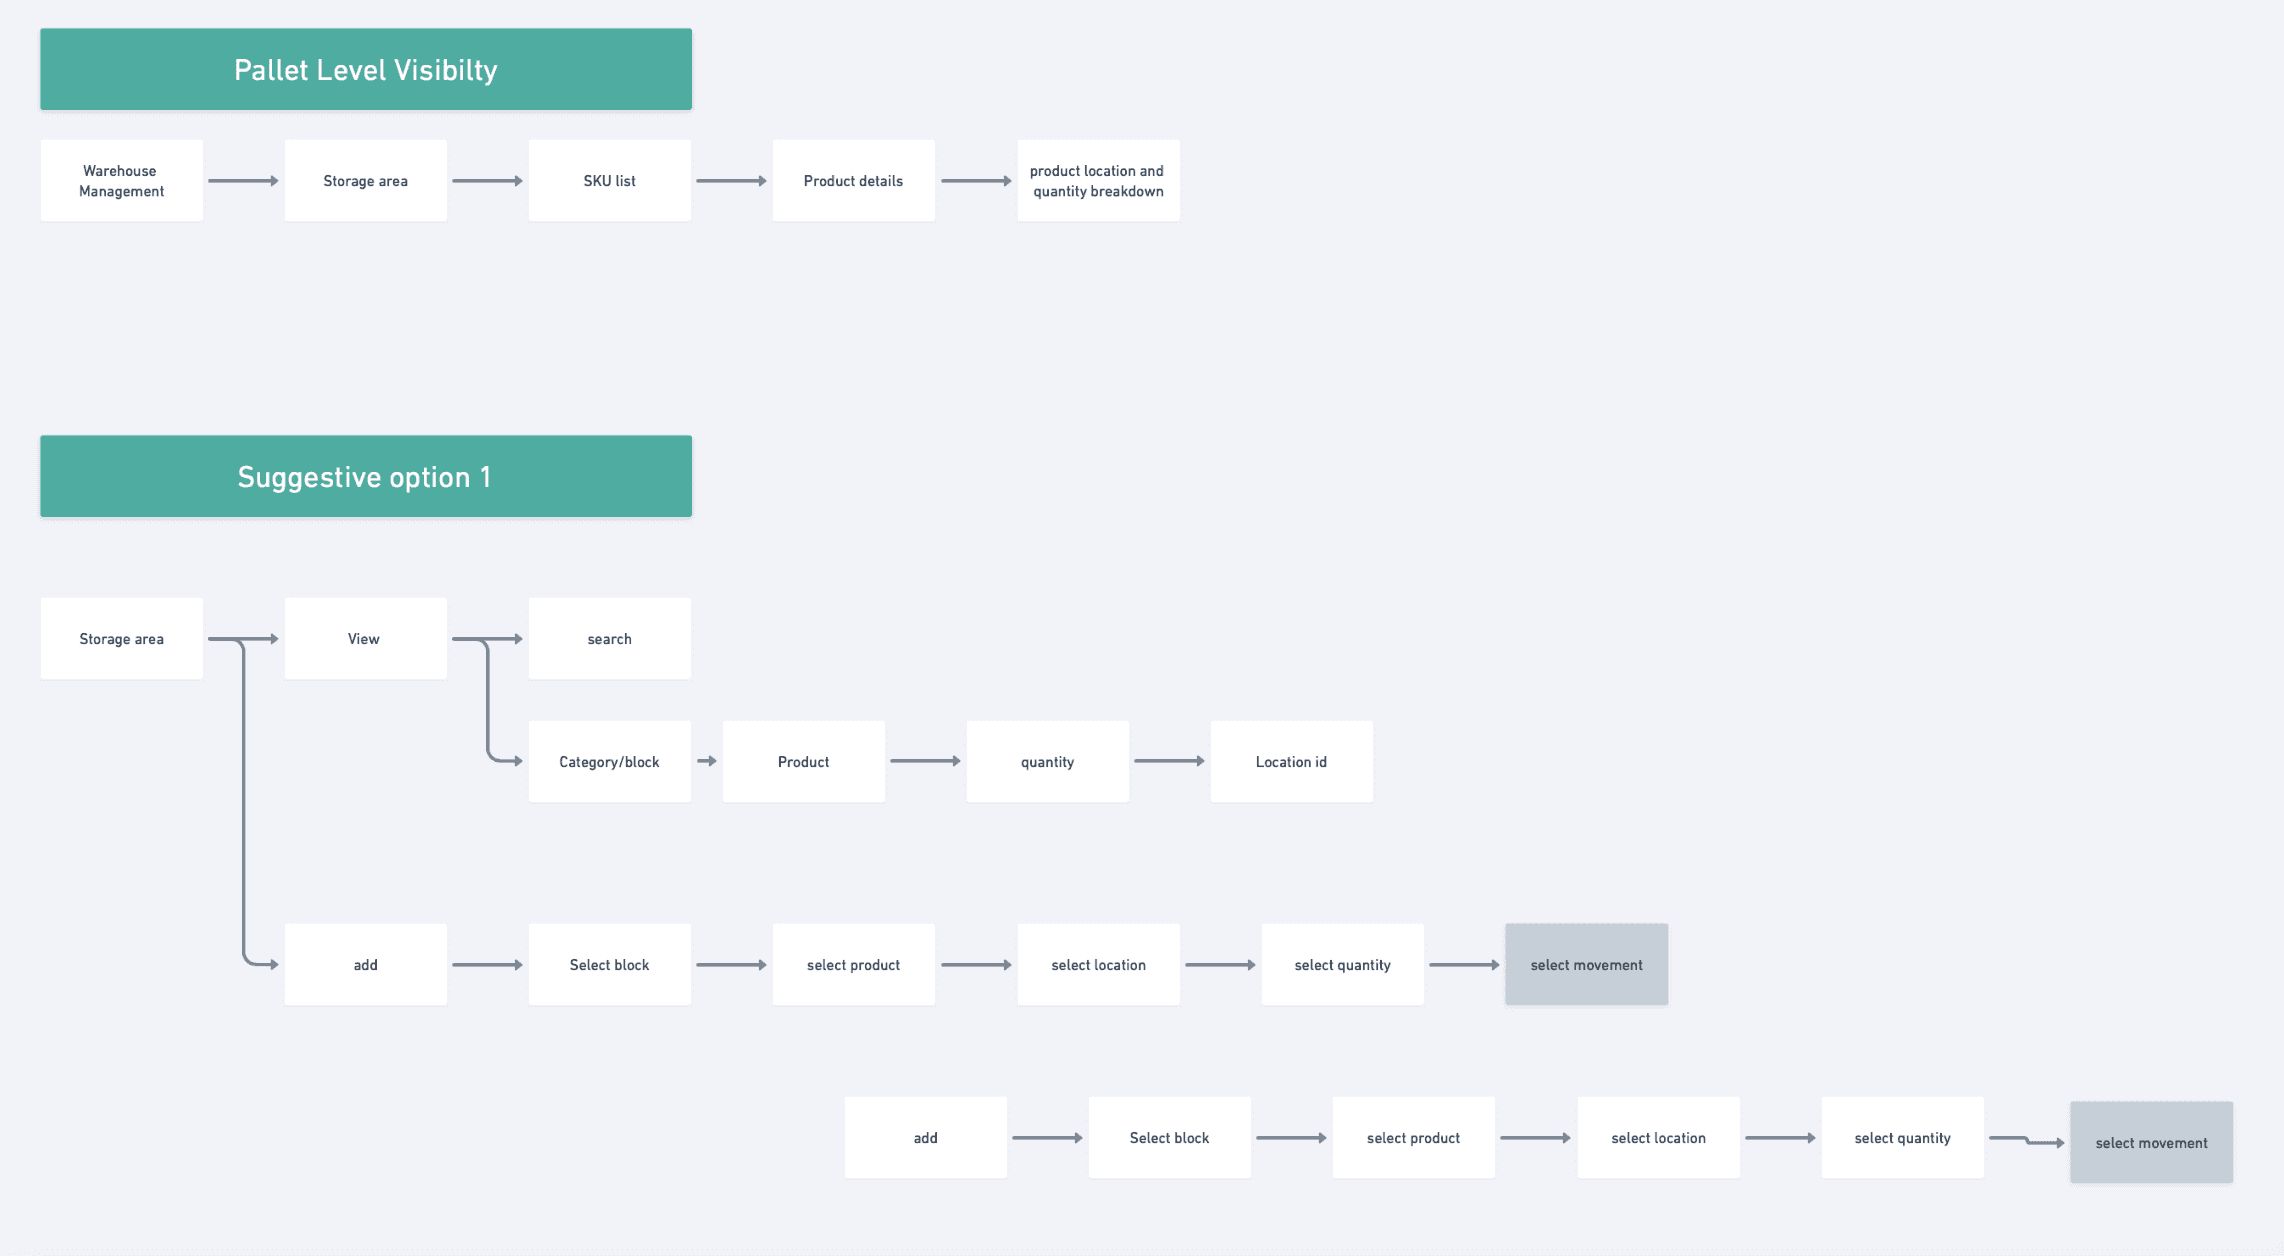
Phase 1: Pallet Level Visbility
(Web-portal)
🔗
Phase 2: Configuration
(Web-portal)
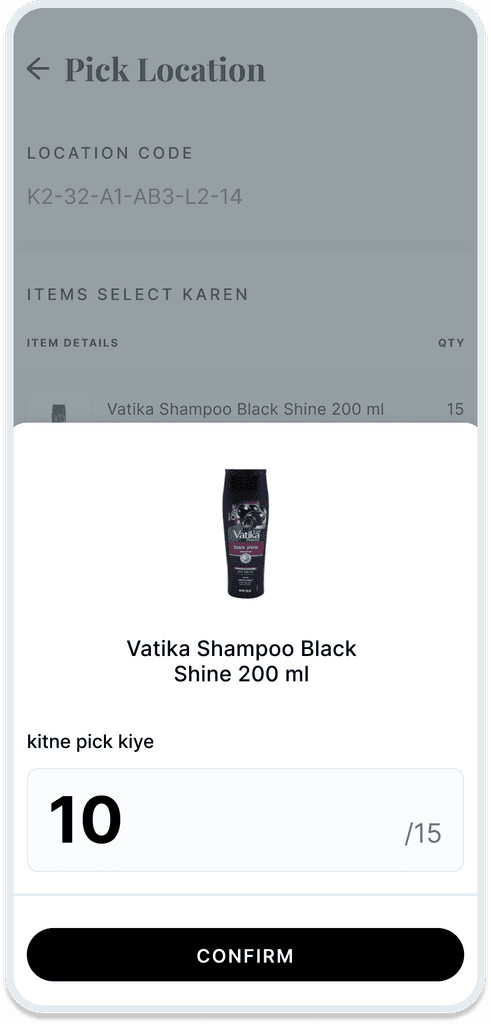
📦
Phase 3: Put Away App
(Mobile App)
Workflow
Using Bazaar's Web Portal's existing Design System

Prototyping

The Final Show


What is the outcome of the hard work?
The Key Performance Indicators
💵
-40% Operational Costs
We achieved a reduction in operational cost by 40% in the first 4 months of rolling WMS 2.0 at K3 Warehouse.
🏭
+30% Warehouse Accuracy
Through streamlining processes and capturing data through launch of 'Put-Away' app, we achieved an increase of 30% in warehouse accuracy.
📱
+70% Task Efficiency
Through reiteration and less manual recording of inventory placements, we achieved 70% task efficiency.


Learning Outcome
🕵🏻♀️
Problem Solving for Operational Efficiency
Addressed critical challenges in warehouse management, such as inaccurate inventory tracking and unstructured warehousing, contributing to enhanced operational efficiency.
🏭
Holistic Understanding of Operations
Gained a holistic understanding of warehouse operations through stakeholder interviews, user research, and competitor analysis, facilitating informed design decisions.
⏳
Cross-Functional Collaboration
Demonstrated effective collaboration with cross-functional teams, including product managers, developers, and quality assurance, fostering a cohesive project environment.
See other work